
By Robert L. Moore, MD, MPH, MBA, Chief Medical Officer
“One’s zip code should not determine one’s health destiny – but in America, it does”
-Robert Ross, CEO California Endowment
Health equity is the focus of much attention recently, with NCQA and DHCS looking for ways to measure and remediate inequities. A major limitation to analysis of health equity in the Medi-Cal population, is that the data available on race, ethnicity, language and gender is self-identified at the time of Medi-Cal application based on limited standardized categories offered by the state. While some providers gather more detailed demographic data, such as gender identity, sexual orientation, or more nuanced ethnicity information, it is not captured in a standardized way and not reported to the health plan or the state, so no analysis based on this more detailed demographic information is possible outside of the provider-level databases. A high priority for making health equity analysis less blunt will be to standardize more detailed race/ethnicity/gender etc. data collected from beneficiaries at the time of application.
Partnership HealthPlan of California (PHC) is able to use the basic member-level ethnicity data we have to evaluate certain clinical data elements that are collected more systematically, as part of HEDIS administrative measures (such as breast cancer screening) or hybrid measures collected as part of the PCP QIP (such as blood pressure control). Outcome data, like maternal mortality or neonatal mortality, is not coded in a way that we can generate accurate rates within our health plan data (county level and state level mortality data is available from CDPH).
There are two patterns that we find with this approach, illustrated with the following examples:
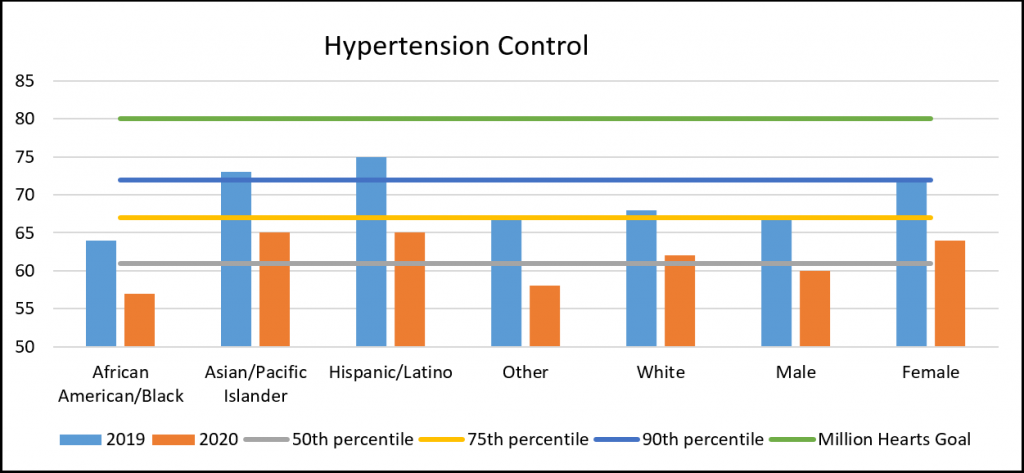
- Hypertension control: Note the declining control overall in 2020, due to the COVID pandemic. Additionally, note less control of blood pressure in the Black and male populations. This chart is based on QIP data, the denominator being much larger than for HEDIS data, where only a small sample of the overall population is evaluated. Consequently, while we are not able to find statistically significant disparities from HEDIS data, we are able to see statistical differences in the QIP dataset. Diabetes control exhibits a similar pattern.
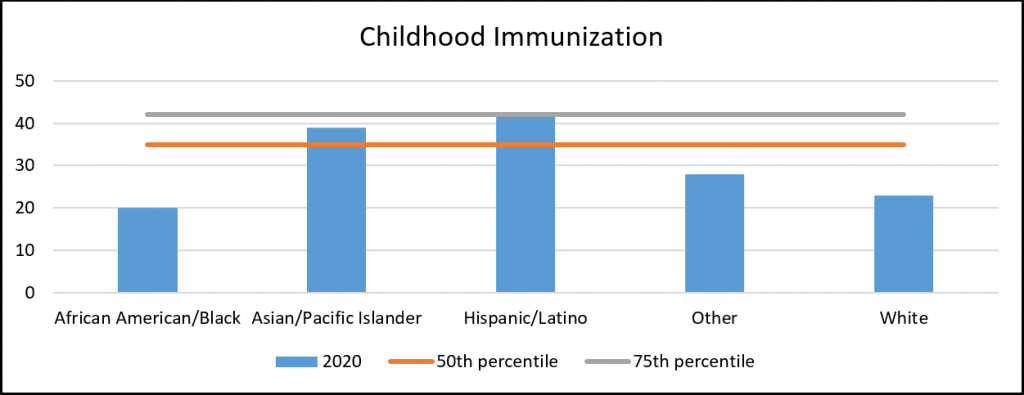
- Childhood Immunization: 10 vaccine series completed by age 2. White and Black children have similarly low vaccination levels, compared to the Asian/Pacific Islander and Hispanic children. Many other clinical measures have a similar pattern, with the health status of white members below that of other ethnic groups.
As this illustrates, not all health disparities are a reflection of inequities. If a socially favored demographic (such as white males) has a worse health status, this disparity would not be considered a reflection of systematic bias or unequal privileges. Such ethnic disparities (in the setting where all groups have Medi-Cal, and so all the comparison groups have low income) may be associated with other factors which could be considered inequities. Examples include, living in a rural area with less access to medical care or having a higher exposure to factors that increase health risk, such as housing instability or substance use.
These examples illustrate the challenges DHCS and NCQA will have as they try to define standardized equity measures that measure performance of health plans. Nonetheless, analyzing the data we have to look for disparities is well worth the effort, to allow a thoughtful contemplation of associations and potential causal factors that we may be able to address.